
See on Scoop.it – AtDotCom Social media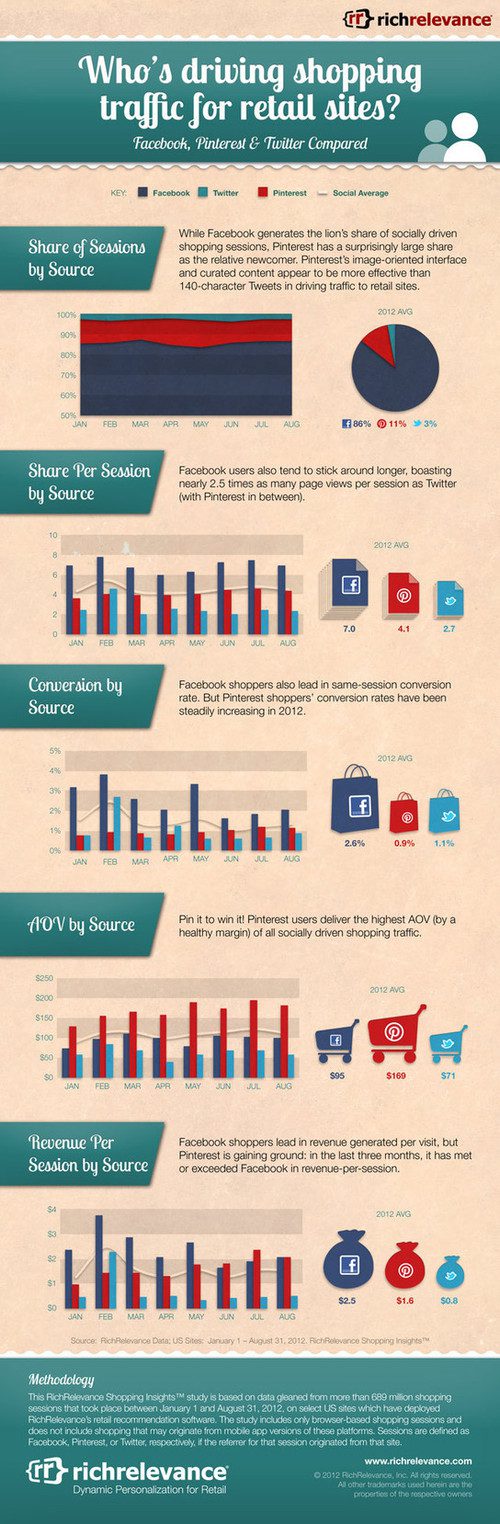
The following Infographic, based on a study from RichRelevance , looked at 689 million shopping sessions on “leading U.S. retail sites” between January 1 and August 31, comparing Facebook, Twitter and Pinterest, in terms of the shopping traffic they drive to retail sites:
•Facebook dominates as a source of traffic: Shoppers who click-through from Facebook account for the overwhelming majority of shopping sessions at nearly 86% (85.8%), followed by Pinterest (11.3%) and Twitter (2.9%).
• Shoppers who started at Facebook browse more – and buy more often: Shoppers who enter retail sites from Facebook tend to stay longer (nearly seven pages per visit vs. nearly three for Twitter and just over four from Pinterest) and purchase somewhat more frequently (conversion rates of 2.63%) than Pinterest (.93%) or Twitter (1.09%).
• Pinterest drives larger orders – nearly double that of other social channels: While shoppers who come to retail sites from Facebook and Twitter purchase more often, Pinterest users spend dramatically more than either ($168.83 average order value vs. $94.70 for Facebook and $70.84 for Twitter).
By RichRelevance . https://bit.ly/NFZOlu
See on www.richrelevance.com